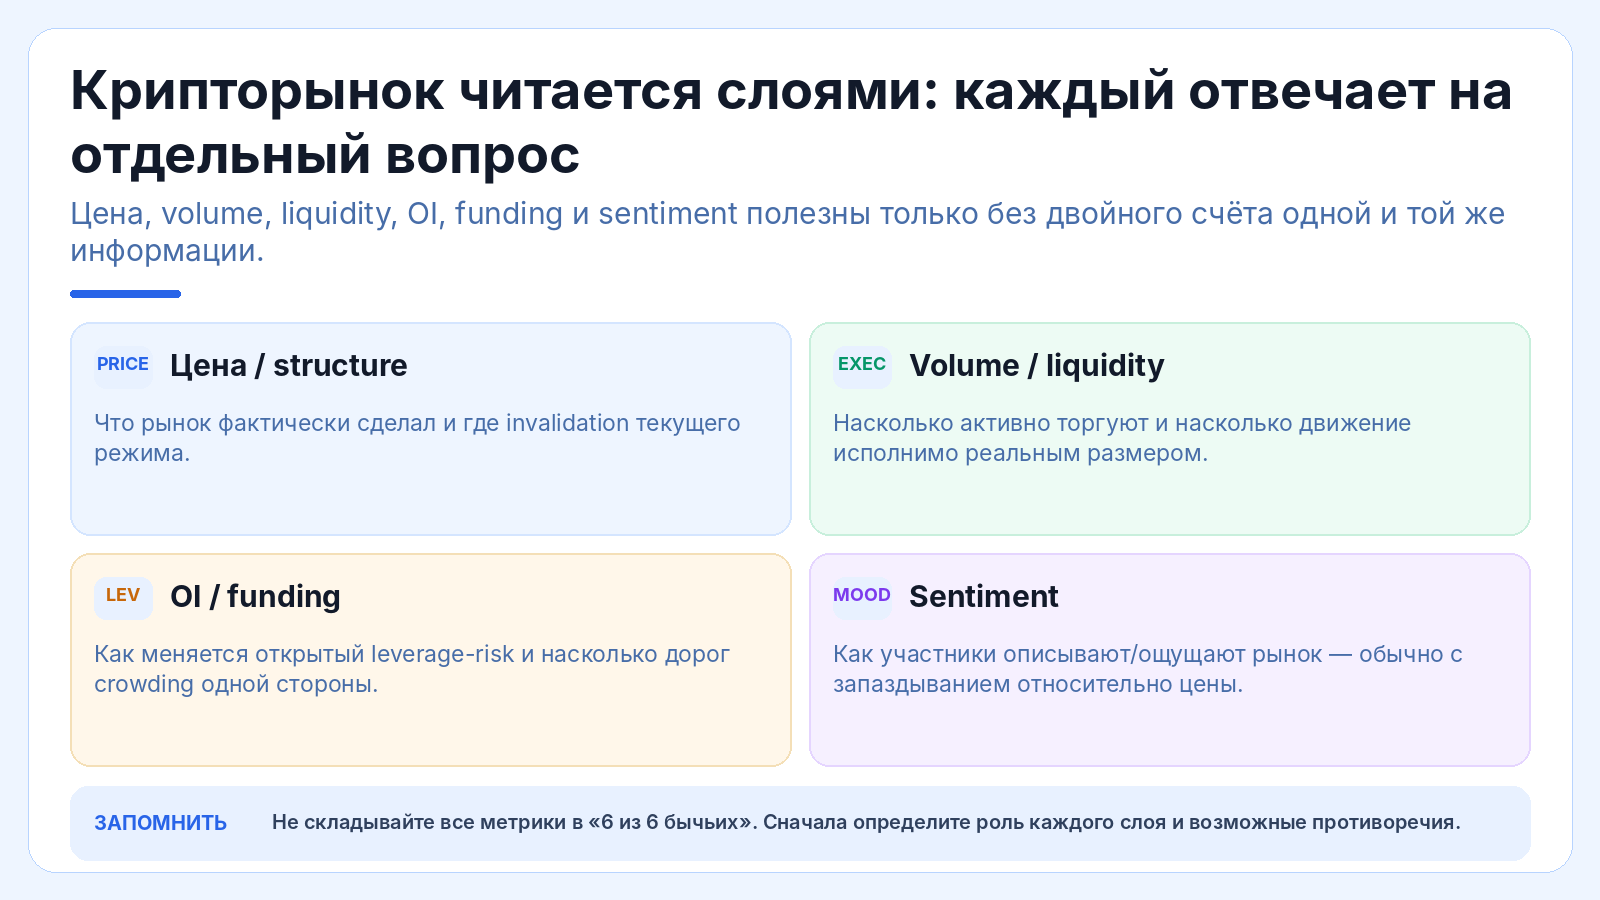
Консолидация в крипте — это период, когда цена перестаёт устойчиво двигаться в одном направлении и проводит заметное время внутри относительно ограниченного диапазона. Верхняя часть диапазона притягивает продажи, нижняя — покупки, а последовательность новых максимумов или минимумов временно ломается. На графике такой режим часто называют боковиком, range или trading range.
Самая опасная ошибка — считать любую горизонтальную картинку «накоплением перед ростом». Консолидация описывает форму движения цены, а не скрытое намерение рынка. Внутри диапазона могут накапливать позицию долгосрочные покупатели, распределять актив ранние holders, нейтрализовать inventory market makers, сокращать leverage или просто ждать новой информации. Один и тот же графический прямоугольник способен завершиться выходом вверх, выходом вниз или продолжением многонедельного боковика.
Вторая ошибка — определять консолидацию только глазами. Диапазон полезно описывать измеримо: верхняя и нижняя граница, средняя цена, ширина range в процентах, длительность, realised volatility, объём, ликвидность, количество ложных выходов и реакция цены на тесты границ. Такой подход позволяет сравнивать два боковика и не подгонять линию после события.
Третья ошибка — путать снижение волатильности с исчезновением риска. Когда цена долго движется в узком диапазоне, участники привыкают к спокойствию, уменьшают запас до stop, повышают размер позиции или leverage. Но накопившееся позиционирование и тонкая ликвидность способны сделать первый сильный выход особенно резким. CFTC отдельно предупреждает, что криптоактивы подвержены высокой волатильности, flash-crash и manipulation risk; спокойный участок истории этого не отменяет.
Эта статья не пытается угадать следующий breakout. Её задача — дать воспроизводимую методику: как определить range, чем консолидация отличается от тренда и случайного шума, как читать volume и depth, почему breakout без acceptance бывает ложным, как различать accumulation и distribution только вероятностно и как строить сценарии риска до выхода цены из диапазона.
Для терминов, которые используются ниже, полезны материалы OneMagic на новом домене: технический анализ криптовалют, ликвидность криптовалюты, капитализация крипторынка и price impact. Здесь они объединяются вокруг одного рыночного режима — консолидации.
Консолидация говорит: рынок временно не смог продолжить прежнее направленное движение. Она не говорит, кто обязательно победит следующим. Направление появляется только после нового баланса спроса, предложения и ликвидности.
Что такое консолидация в крипте простыми словами
Боковик — это режим, а не одна свеча
Если цена несколько часов стоит почти на месте после резкого импульса, этого недостаточно для надёжного вывода о сформировавшемся диапазоне. Консолидация предполагает повторяющееся взаимодействие цены с областью спроса и предложения.
Чем больше независимых тестов границ и времени внутри range, тем содержательнее режим.
У range есть верхняя и нижняя область
Resistance-area показывает зону, где дальнейший рост неоднократно встречает предложение. Support-area — где снижение привлекает спрос.
Лучше мыслить областями, а не линиями толщиной в один tick: реальное исполнение распределено по ценам.
Средняя часть диапазона тоже информативна
Цена часто вращается вокруг условного equilibrium — области, где краткосрочные buyers and sellers примерно уравновешены.
Отношение к середине range помогает описать, кто получает инициативу внутри боковика, но не предсказывает конечный breakout.
Ширина консолидации измеряется в процентах
Range 100–105 имеет ширину около 5% относительно нижней границы, а диапазон 100–140 — уже 40%. Оба могут выглядеть горизонтально на разном масштабе.
Нормализация в процентах делает сравнение честнее.
Длительность имеет значение
Часовая консолидация, недельный боковик и годовой trading range — разные структуры и участники.
Перед анализом всегда фиксируйте timeframe.
Консолидация может возникать после роста
Рынок переваривает предыдущий импульс: часть участников фиксирует прибыль, новые buyers оценивают valuation, volatility снижается.
Это может стать continuation pattern, но может оказаться вершиной распределения.
Консолидация может возникать после падения
Продавцы временно теряют силу, buyers начинают принимать supply, а цена перестаёт обновлять lows.
Это может быть дном накопления или паузой перед следующим снижением.
Консолидация может возникать без предшествующего тренда
Молодой или малоликвидный актив способен долго торговаться в узком коридоре без заметной направленной истории.
В таком случае термин accumulation особенно опасно использовать без дополнительных данных.
Диапазон не означает равный объём спроса и предложения
Цена равновесна только на margin: очередной buyer и seller встречаются около текущего уровня. Общие скрытые намерения участников неизвестны.
Большие лимитные заявки, off-chain positions и будущие flows не видны полностью.
Консолидация заканчивается не первым проколом
Цена может кратко выйти за boundary и вернуться. Для многих методик breakout требует удержания, закрытия периода, объёма или повторного acceptance.
Какой критерий использовать, нужно решить до события.
| Признак | Консолидация | Тренд |
|---|---|---|
| Максимумы/минимумы | Перекрываются внутри range | Системно смещаются |
| Направление | Слабое/неустойчивое | Устойчивое |
| Volatility | Часто снижается | Может расширяться |
| Границы | Повторно тестируются | Предыдущие уровни уходят |
| Главный вопрос | Где появится новый imbalance? | Когда trend потеряет структуру? |
Почему формируется боковик: баланс спроса, предложения и ожиданий
После импульса меняется marginal buyer
Ранние buyers уже купили, а новым участникам нужна новая причина принять более высокую цену. Если продавцы тоже не готовы давить ниже, возникает временный equilibrium.
Боковик отражает паузу в переоценке.
Фиксация прибыли встречает новый спрос
После сильного роста часть holders продаёт. Если incoming demand примерно поглощает supply, цена перестаёт расти, но и не падает.
На графике это может выглядеть как распределение или здоровое переваривание роста.
После падения продавцы истощаются
Forced selling, panic or deleveraging заканчиваются, а buyers начинают принимать supply на более низких уровнях.
Если нового фундаментального спроса недостаточно, диапазон может быть лишь временной остановкой.
Участники ждут события
Protocol upgrade, macro release, unlock, governance vote, regulatory decision or product launch способны временно снижать willingness совершать крупные directional сделки.
Price compresses until uncertainty resolves.
Market makers нейтрализуют inventory
Двухсторонняя liquidity создаёт продажи ближе к upper range and purchases ближе к lower range, если market-maker risk model позволяет.
Это поддерживает mean-reverting behaviour, пока не приходит внешний imbalance.
Leverage сокращается без крупного движения цены
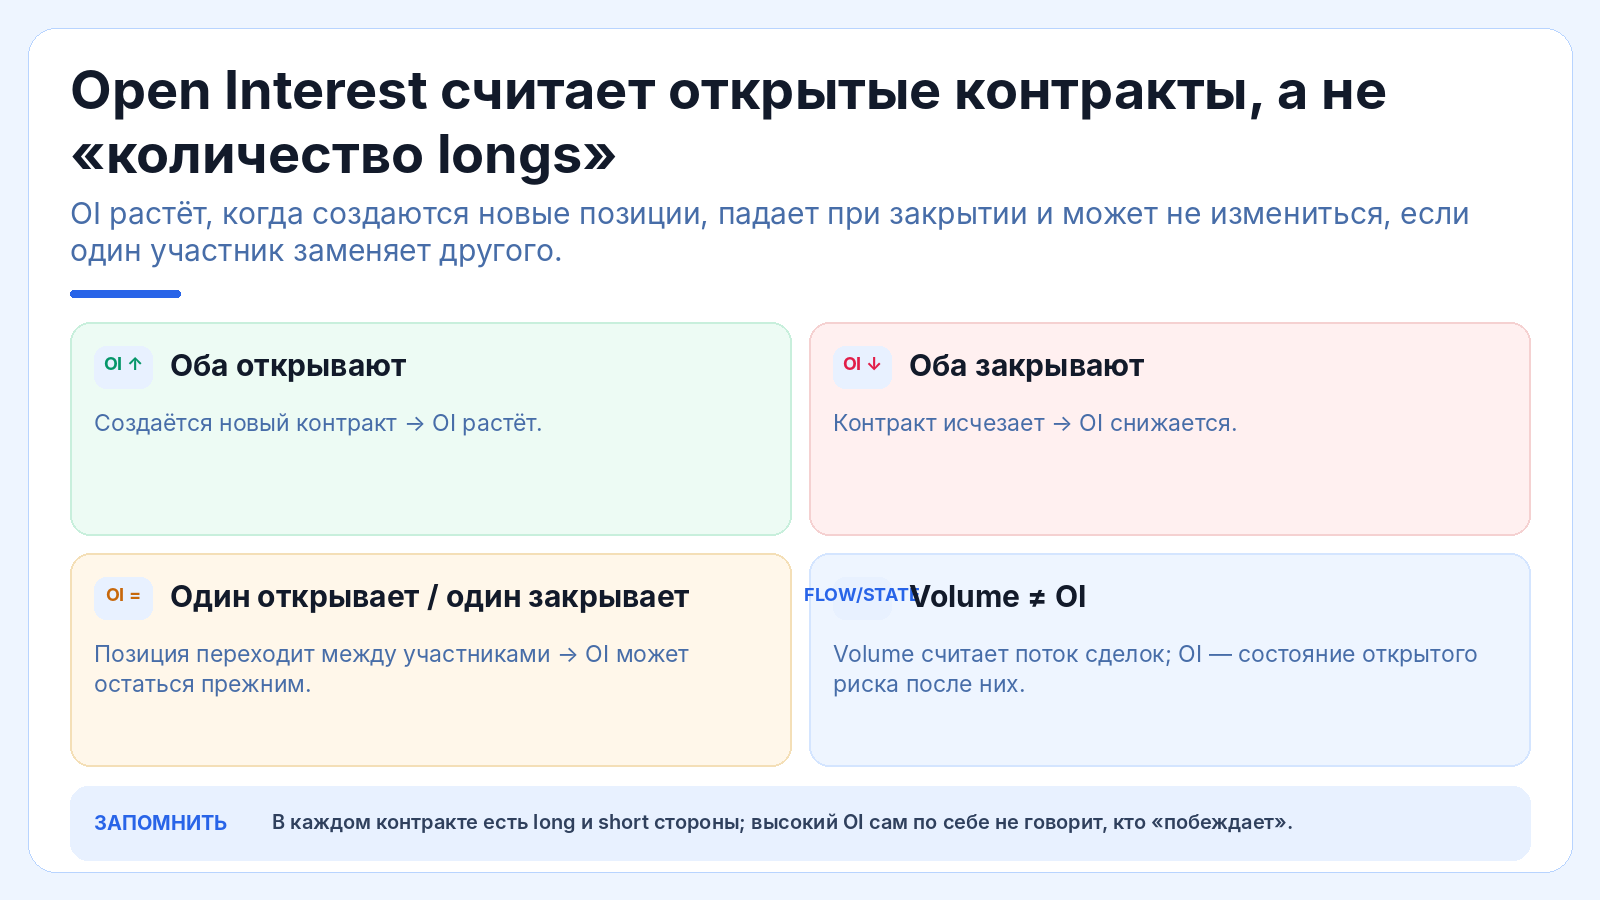
После волатильного периода long и short positions могут закрываться, open interest уменьшаться, а spot price оставаться внутри коридора.
Deleveraging иногда делает последующий рынок здоровее, но не определяет направление.
Supply unlock может поглощаться постепенно
Новые liquid tokens выходят на рынок, но buyers принимают их без значительного trend move.
Range тогда является зоной перераспределения ownership.
Treasury или крупный holder может распределять supply
Постепенная продажа ограничивает рост, не создавая crash, если demand устойчив.
Без entity flow данных один график не доказывает distribution.
Долгосрочные buyers могут накапливать
Покупки у нижней границы повторяются, часть supply переходит к более терпеливым holders.
Но accumulation — гипотеза, пока её не поддерживают holder flows and subsequent acceptance higher.
Макроэкономическая неопределённость снижает conviction
Crypto remains sensitive to broad risk appetite. Когда competing macro scenarios balanced, price can oscillate instead of trend.
Смена external liquidity conditions способна резко завершить range.
Низкая ликвидность сама создаёт псевдобоковик
Если trades редкие, last price может долго не двигаться просто потому, что никто не торгует.
Настоящая active consolidation отличается от мёртвого рынка наличием устойчивых bids, asks and turnover.
Алгоритмические стратегии усиливают mean reversion
Некоторые strategies систематически sell upper deviations and buy lower deviations while regime stable.
When breakout begins, these strategies can reverse or stop, accelerating movement.
| Причина range | Что видно | Что нельзя утверждать |
|---|---|---|
| Profit taking + demand | Стабильная цена после роста | Что идёт distribution |
| Seller exhaustion | Нет новых lows | Что дно сформировано |
| Event wait | Снижение activity/volatility | Направление результата |
| Gradual unlock absorption | Supply растёт без падения | Что unlock безопасен навсегда |
| Low liquidity | Мало движения | Что рынок сбалансирован |
| Market making | Mean reversion | Что market maker контролирует тренд |
Как измерять консолидацию: range, volatility, ATR, volume и liquidity
Зафиксируйте timeframe до построения range
На 5-minute chart может быть боковик внутри сильного daily uptrend. На weekly chart тот же участок почти незаметен.
Мульти-таймфрейм анализ предотвращает противоречивые выводы.
Определите boundary как область
Используйте повторные реакции цены, closes and traded volume to outline support/resistance zones.
Одна случайная wick не обязана определять весь range.
Посчитайте width
Width = upper boundary / lower boundary − 1. Сравните width с typical volatility актива.
Узкий range для Bitcoin может быть широким для stablecoin-like asset.
Посчитайте realised volatility
Можно использовать стандартное отклонение returns на выбранном окне. Снижение realised volatility часто сопровождает compression.
Но low volatility can persist much longer than expected.
ATR-like range показывает typical movement
Average True Range или аналогичная средняя амплитуда помогает сравнить текущий диапазон с недавними candles.
If boundary distance only one normal ATR, breakout noise probability high.
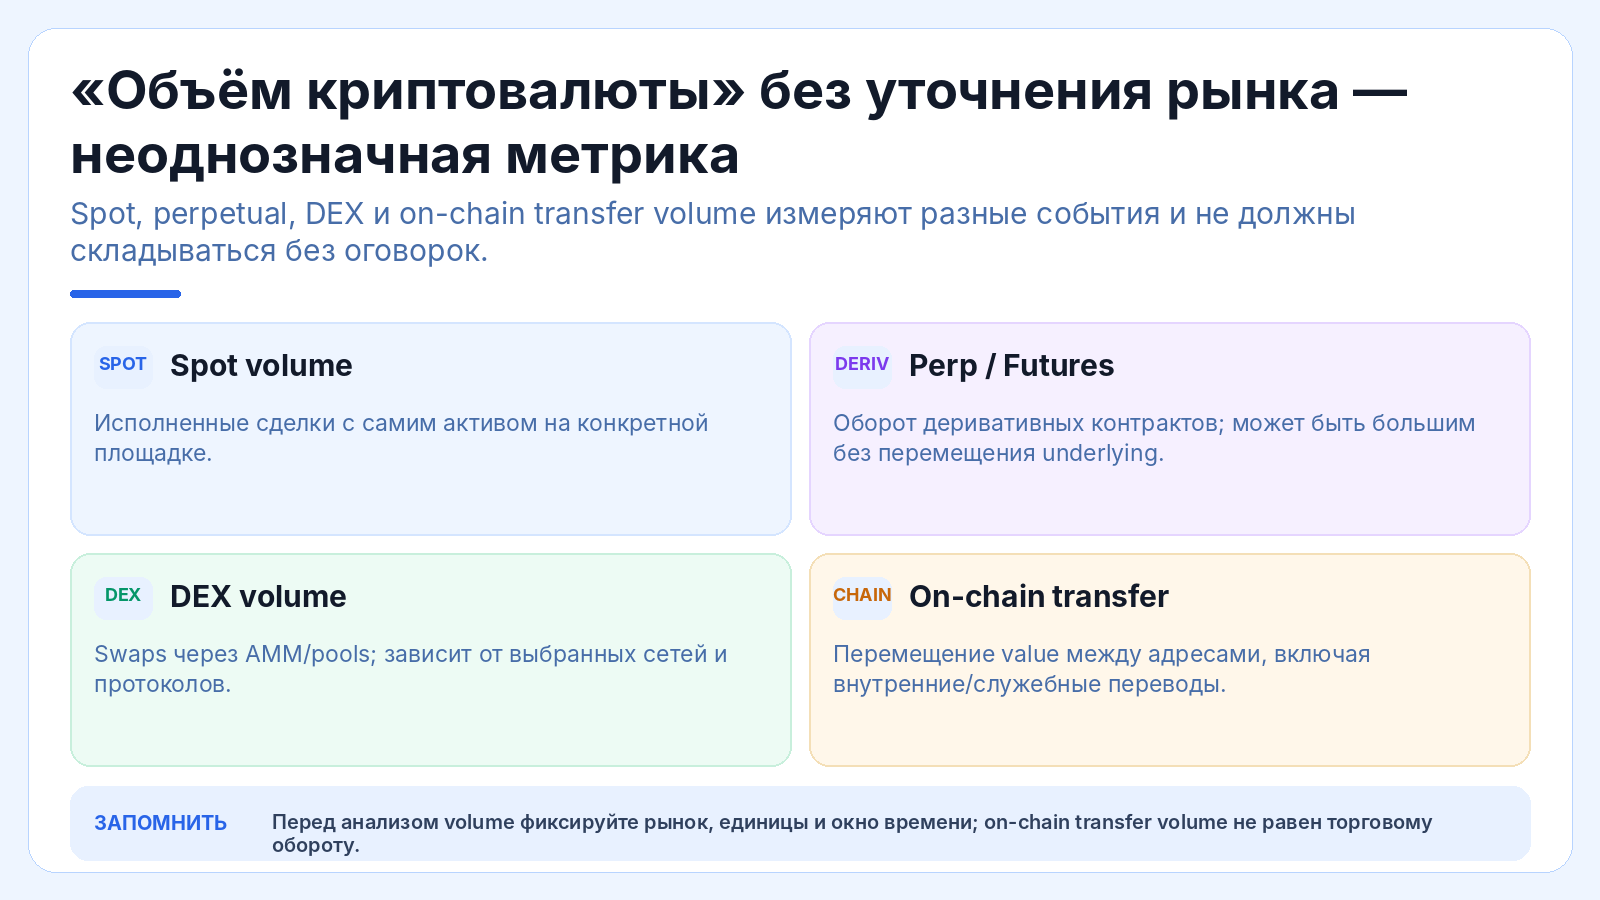
Volume измеряет оборот, не depth
Большой объём внутри боковика показывает активный обмен ownership, но не гарантирует, что крупный order можно исполнить без impact.
Поэтому volume всегда дополняется liquidity.
Depth показывает доступный спрос и предложение сейчас
Order-book depth or AMM reserves describe current execution capacity.
Range with weak depth is more vulnerable to abrupt move.
Spread показывает качество price discovery
Narrow spread suggests nearby buyers and sellers. Wide spread in ‘sideways’ market can indicate illiquidity rather than healthy consolidation.
Use spread relative to asset volatility and position size.
Price impact нужно проверять size-aware
Quote for $100 can be fine, while $10,000 moves average price several percent.
Your personal range risk depends on your own exit size.
Volume-at-price helps locate accepted areas
Если available methodology shows where substantial turnover occurred, high-volume nodes can indicate areas market repeatedly accepted.
Do not turn profile into deterministic support/resistance.
Number of boundary tests matters
Repeated tests provide more evidence that participants respond around zone, but can also consume resting liquidity.
Sixth test is not automatically stronger than first.
Time spent near boundary matters
Price that immediately rejects upper range behaves differently from price that spends hours near it and absorbs offers.
Acceptance can precede breakout but is not certainty.
Volatility compression can be quantified
Compare recent range or standard deviation with longer baseline.
Compression gives regime context, not direction.
Liquidity can migrate during consolidation
Depth may increase near midpoint or disappear at edges as market participants update orders.
Static snapshot should be repeated.
| Метрика | Что измеряет | Главное ограничение |
|---|---|---|
| Range width | Ширина боковика | Зависит от boundaries |
| Realised volatility | Фактические колебания | Запаздывает |
| ATR-like measure | Средняя амплитуда | Не показывает направление |
| Volume | Оборот | Не равно liquidity |
| Depth | Исполнимый объём | Меняется мгновенно |
| Spread | Разрыв bid/ask | Зависит от размера/market |
| Time at boundary | Acceptance | Не гарантирует breakout |
Accumulation или distribution: что можно и нельзя понять внутри консолидации
График сам не показывает личность покупателя
Every sell has buyer and every buy has seller. Candle cannot tell whether buyers are long-term funds or short-term market makers.
Labels accumulation/distribution require additional evidence.
Accumulation hypothesis strengthens with holder absorption
If large unlock or seller flow occurs but price holds and supply migrates to many independent holders, market may be absorbing.
Still need time and subsequent higher acceptance.
Distribution hypothesis strengthens with persistent large-holder outflow
Confirmed entities reduce balances, liquidity weakens and rallies fail despite positive news.
This is stronger than visual rectangle alone.
Volume alone cannot distinguish them
High volume may mean transfer from weak to strong hands or opposite.
Direction and entity context matter.
On-chain flow can help but is incomplete
Transfers to smart contracts, bridges or custodians do not equal sales. Entity clustering has uncertainty.
Use net economic flow, not raw transactions.
Cost basis matters
Early holders can profit at prices far below retail break-even and distribute without bearish long-term view.
Know whose supply is active.
Stable price during unlock is useful evidence
If large scheduled supply becomes liquid and market remains stable, demand demonstrated absorption capacity.
It does not guarantee future unlocks will behave same.
Rising liquidity inside range can be constructive
More depth and narrower spread make market more resilient.
Direction still unknown.
Falling liquidity inside range is warning
Price looks stable but less capital supports it. First imbalance can move price sharply.
Sideways last price can hide deterioration.
Positive fundamentals with no price response can mean supply overhang
Good news fails to lift price because sellers use demand to exit.
Or market already priced news. Multiple explanations remain.
Negative news with no breakdown can indicate seller exhaustion
If market absorbs bad information without new lows, downside supply may be reduced.
Again, one event is insufficient.
Higher lows inside range are not full breakout
Buyers may become more aggressive, but upper supply remains.
Treat as internal structure, not confirmation.
Lower highs inside range show pressure
Sellers appear earlier, but lower boundary can still hold.
Compression triangle still needs resolution.
Use probabilistic labels
Instead of ‘this is accumulation’, write ‘evidence consistent with accumulation: A, B, C; contrary evidence: D’.
This protects analysis from narrative certainty.
Breakout из консолидации: как отличать выход из range от ложного прокола
Первый выход за границу — только событие, не подтверждение
Цена может пересечь upper boundary на одной свече, потому что крупный market order снял ближайшие offers. Пока рынок не показал способность торговаться и удерживаться выше, говорить о новом устойчивом режиме рано.
Именно поэтому многие системы используют close, retest, volume, time acceptance or structure confirmation.
Закрытие периода уменьшает влияние случайного wick
Если выбранный timeframe — 4 часа, breakout по 4-hour close обычно устойчивее, чем секундный spike. Но более позднее подтверждение означает худшую цену входа.
Это классический trade-off между speed and certainty.
Acceptance важнее самого crossing
Когда цена после выхода проводит время за boundary, новый уровень начинает восприниматься как рабочая зона, а не случайный экстремум.
Acceptance можно оценивать временем, объёмом and ability to survive pullbacks.
Retest проверяет смену ролей
После upside breakout рынок иногда возвращается к бывшей верхней границе. Если buyers удерживают её, старое resistance становится support-like reference.
Retest не обязателен и не гарантирует continuation; это лишь дополнительная проверка.
False breakout быстро возвращает цену внутрь
Цена выходит за range, привлекает momentum traders, затем возвращается ниже upper boundary или выше lower boundary.
Причина может быть недостаточный demand, thin liquidity, squeeze completion or simply random volatility.
SFP-like behaviour — особый вариант ложного выхода
Цена забирает ликвидность за предыдущим extreme, но close возвращается внутрь.
Такой pattern часто называют swing failure, но он не является универсальным reversal signal.
Volume expansion может подтверждать participation
Breakout на растущем turnover показывает, что в движении участвует больше капитала.
Однако volume без depth может быть churn, liquidations or wash-like activity.
Spot-led breakout отличается от leverage-led
Если рост сопровождается сильным spot demand and moderate derivatives leverage, структура может быть устойчивее, чем squeeze with extreme funding/open interest.
Но exact attribution всегда imperfect.
Liquidity gap может сделать breakout слишком быстрым
Если за boundary мало resting orders, цена проходит большой путь на небольшом объёме.
Fast move выглядит powerful, но может оказаться fragile because little two-sided trade occurred.
Repeated failed breakouts matter
Если цена много раз выходит выше и быстро возвращается, seller response around same zone persists.
Still, each failed attempt may consume supply; pattern can eventually change.
Breakdown ниже range анализируется симметрично
Close, acceptance, volume, retest and liquidity apply to downside as well.
Do not treat downside breakout as inherently more truthful than upside.
Gap in data or bad feed can fake breakout
One source may show spike others do not. Before acting on extreme move, verify multiple data feeds or primary market state.
Data quality belongs in technical analysis.
News breakout needs follow-through
Headline can move price outside range instantly. After first reaction ask whether new information changes valuation enough to support price after event traders exit.
News direction is not same as durable price acceptance.
Breakout target formulas are heuristics
Some traders project range width from breakout point. This geometric target has no economic guarantee.
Use it as scenario reference, not promised destination.
Invalidation should be explicit
If your breakout thesis requires daily close above boundary, return below specific area or loss of volume can invalidate it.
Define rule before entry to avoid post-hoc story.
| Breakout-признак | Что усиливает доверие | Что ослабляет |
|---|---|---|
| Close outside range | Удержание вне boundary | Только wick |
| Acceptance | Время/объём за границей | Быстрый возврат |
| Retest | Удержание новой стороны | Полный возврат в range |
| Liquidity | Глубина растёт | Gap/тонкий рынок |
| Volume | Новый participation | Churn without depth |
| Positioning | Не экстремально crowded | Squeeze-only move |
Типы консолидации: прямоугольник, сужение диапазона, флаг и распределение volatility
Горизонтальный прямоугольник — самый простой range
Upper and lower boundaries remain roughly parallel. Price repeatedly rotates between them.
Useful for clear measurement but real market rarely respects exact lines.
Сужающийся диапазон отражает compression
Lower highs and higher lows reduce amplitude. Buyers and sellers become increasingly aggressive around midpoint.
Triangle-like shape gives no guaranteed breakout direction.
Ascending structure inside range shows buyer pressure
Higher lows form while upper boundary stays similar. Demand appears earlier on each pullback.
This can resolve upward, but failed ascending structures can break sharply down.
Descending structure shows seller pressure
Lower highs appear against relatively stable floor.
Again, pressure is evidence, not certainty.
Flag-like consolidation follows impulse
After strong directional move, price pauses in smaller counter-trend or sideways channel.
Continuation is common enough to be named pattern, but every flag can fail.
Volatility shelf can be broad rather than visually neat
Price spends most time inside a wide distribution with occasional excursions.
Rigid rectangle can oversimplify this state.
Nested ranges occur across timeframes
Daily range may contain several 1-hour consolidations. A breakout on lower timeframe may simply move price to opposite side of higher-timeframe range.
Always state which structure you trade.
Range expansion can precede trend
Volatility may first widen inside broader boundaries before directional break.
Do not assume compression always precedes breakout.
Range migration shifts equilibrium
Price forms one sideways zone, then establishes another higher or lower without strong trend candles.
This staircase behaviour can reflect gradual repricing.
High-volume consolidation differs from quiet compression
Heavy turnover with stable price implies large ownership transfer. Quiet compression implies fewer transactions and lower realised volatility.
Both can breakout, but interpretation differs.
Post-capitulation base can be asymmetric
After crash, long lower wicks and rapid absorption create wide irregular bottoming range.
Calling precise horizontal lines may be misleading.
Distribution top can look identical to continuation until break
Price after rally remains near highs while early holders sell into demand.
Only later does inability to hold range reveal bearish resolution.
Accumulation bottom can look weak until buyers prove control
Price after decline remains dull while sellers finish. A later breakout creates retrospective accumulation label.
Do not label certainty beforehand.
Range with rising open interest is structurally different
Leverage accumulates while spot price stable. Break can trigger liquidation cascade.
Positioning data adds risk context.
Range with falling open interest may be deleveraging
Participants close positions without directional price move.
Subsequent breakout may have cleaner leverage structure.
Риск-менеджмент внутри боковика: почему range trading ломается на одном выходе
Mean reversion works only while regime persists
Buying lower range and selling upper range assumes boundaries continue attracting opposite flow.
One genuine breakout can erase multiple small wins if stop or position sizing poor.
Do not place risk beyond infinity
Trader who says ‘if lower boundary breaks I’ll just wait’ silently converts range trade into investment.
Define invalidation before entry.
Position size should reflect distance to invalidation
Closer stop allows larger nominal size only if liquidity supports execution and false-break frequency acceptable.
Do not size solely by chart distance.
Stops near obvious boundaries can be noisy
Price often probes extremes before reverting. Tight stop may be repeatedly triggered.
Trade-off: wider stop lowers noise but increases loss per unit.
No-stop does not remove stop risk
Without order, market still creates economic loss. Illiquid move can become much larger.
Risk exists whether formalized or ignored.
Take-profit near opposite boundary should account for front-running
Many participants target same extreme, so price may reverse before exact line.
Using zones rather than single tick can be more realistic.
Mid-range has poor asymmetry for range trades
Entry near center often leaves similar distance to upside and downside without clear edge.
Best risk/reward usually appears nearer defined boundaries, but false breaks remain.
Breakout trades need different rules than range trades
Buying upper boundary expecting mean reversion and buying breakout above it are opposite theses.
Do not switch silently after execution.
Leverage is especially dangerous after volatility compression
Low recent volatility makes leverage look safe. Breakout then expands volatility exactly when position largest.
Use stress volatility, not recent calm only.
Cross-position correlation matters
Several altcoins can consolidate simultaneously because broad market waiting. Breakout direction may be correlated.
Five range trades can be one macro bet.
Liquidity risk increases near event times
Before scheduled announcement, market makers may pull orders. Same range size suddenly produces larger slippage.
Reduce size or update quotes.
Weekend/off-hour conditions can change depth
Crypto trades 24/7 but liquidity varies by time and asset.
Range observed during deep hours may break in thin session.
Use actual executable quote for stop scenario
Chart stop at 100 does not guarantee fill at 100. Simulate market depth below boundary.
Tail loss can exceed planned loss.
Partial exits reduce binary outcomes
Trader can scale out as price approaches boundary or after partial breakout.
This changes expectancy and should be planned, not improvised.
Time stop prevents dead capital
If consolidation persists longer than strategy horizon, opportunity cost grows.
Review trade after predefined time even if price still inside range.
Risk budget should survive repeated false breaks
Consolidation can produce several traps before final move.
If two or three stopped attempts destroy account, sizing too aggressive.
Separate analysis from execution
Correct view that range will break upward can still lose if entry too early, leverage high or stop inside noise.
Outcome depends on implementation.
Portfolio range exposure should be aggregated
If all assets break on same Bitcoin move, nominal diversification is false.
Stress whole portfolio with simultaneous boundary failure.
| Range-ошибка | Что происходит | Контроль |
|---|---|---|
| Покупка mid-range | Слабая asymmetry | Ждать края/нового setup |
| No invalidation | Trade превращается в bag | Задать exit |
| High leverage | Compression кажется безопасной | Stress-test breakout |
| Many correlated ranges | Скрытая концентрация | Portfolio stress |
| Exact-line target | Рынок разворачивается раньше | Использовать zones |
| Ignoring liquidity | Stop fills хуже | Size-aware quote |
Практические сценарии консолидации: как читать range без гадания
Сценарий 1. После роста цена две недели стоит у highs
Это может быть healthy digestion или distribution. Смотрите holder flow, volume, liquidity and reaction to bad news.
Само местоположение near highs не определяет исход.
Сценарий 2. После падения цена перестала обновлять lows
Seller pressure weakened, but buyers ещё не доказали новый trend.
Range bottoming hypothesis requires breakout/acceptance or improving fundamentals.
Сценарий 3. Upper boundary тестируется пять раз
Offers repeatedly absorb demand. Это resistance evidence.
Но repeated testing can also consume supply; do not assume sixth rejection.
Сценарий 4. Lower boundary тестируется много раз
Buyers defend area, but each test may consume bids.
Watch depth and bounce strength.
Сценарий 5. Bounces from lower boundary become weaker
Demand response deteriorates.
Probability of breakdown may rise, but still not certainty.
Сценарий 6. Rejections from upper boundary become weaker
Sellers have less impact or buyers absorb supply.
Upside pressure grows.
Сценарий 7. Volume declines throughout range
Typical compression or loss of interest.
Direction unknown; liquidity quality determines breakout risk.
Сценарий 8. Volume rises while price stable
Large ownership transfer happening.
Could be accumulation, distribution or churn.
Сценарий 9. Depth grows on both sides
Market becomes more liquid and two-sided.
Breakout may require larger imbalance.
Сценарий 10. Depth disappears while price stable
Fragile equilibrium.
First large order can move market far.
Сценарий 11. Spread widens inside range
Market quality deteriorates despite stable last price.
Do not treat calm chart as low risk.
Сценарий 12. Spread narrows and depth improves
Execution quality strengthens.
Still no directional signal.
Сценарий 13. Price briefly breaks upper boundary then returns
False-break candidate.
Check close, volume and whether next attempt holds.
Сценарий 14. Price closes above and retests successfully
Evidence for new higher acceptance.
Still stress broad-market reversal.
Сценарий 15. Price breaks down on thin weekend liquidity
Move may extend because bids sparse or reverse when depth returns.
Check cross-market confirmation.
Сценарий 16. Breakout occurs on major news
New information explains imbalance.
Assess whether economics justify sustained repricing.
Сценарий 17. Breakout without news
Order flow itself can change regime.
Do not require headline for real move.
Сценарий 18. Market-wide range, one token breaks early
Relative strength or idiosyncratic catalyst.
Check if broader market later confirms or suppresses move.
Сценарий 19. Bitcoin ranges, altcoins trend
Capital rotates within crypto.
Do not generalize BTC structure to every asset.
Сценарий 20. Token range overlaps large unlock
Stable price during new supply suggests absorption.
Track recipient sales and depth.
Сценарий 21. Token range before unlock
Participants may wait for supply event.
Breakout before unlock can reverse after actual distribution.
Сценарий 22. Range after airdrop
Recipients sell, new buyers absorb.
Net holder distribution can reveal ownership transfer.
Сценарий 23. Range after exploit recovery
Market reassesses trust and compensation.
Technical fix alone may not restore valuation.
Сценарий 24. Range while users grow
Fundamentals improve before price responds.
Could be accumulation or simply valuation already high.
Сценарий 25. Range while users fall
Price stability can hide worsening fundamentals.
Supply/demand may adjust later.
Сценарий 26. Positive news repeatedly fails to break upper range
Supply overhang or priced-in expectations possible.
Failure response is meaningful but not deterministic.
Сценарий 27. Negative news repeatedly fails to break lower range
Seller exhaustion/absorption possible.
Look for subsequent higher lows or improved liquidity.
Сценарий 28. Open interest rises, funding near zero
Leverage accumulates on both sides.
Breakout may trigger squeeze depending positioning.
Сценарий 29. Open interest falls, price stable
Deleveraging without directional move.
Subsequent market may be less crowded.
Сценарий 30. Funding strongly positive in upper range
Long side crowded.
Upside can continue, but downside liquidation risk larger.
Сценарий 31. Funding strongly negative near lower range
Short side crowded.
Breakdown can continue or squeeze sharply.
Сценарий 32. Range forms around old ATH
Psychological break-even and price-discovery boundary interact.
Use current supply/liquidity, not historical level alone.
Сценарий 33. Range forms around old support
Participants remember prior level.
Current order flow matters more than memory.
Сценарий 34. Asset ranges while market cap rises
Circulating supply may be expanding.
Price stability can hide aggregate valuation growth.
Сценарий 35. Asset ranges while supply burns
Aggregate valuation may fall/change despite same unit price.
Separate price and supply.
Сценарий 36. Rebase token appears range-bound
Unit balance changes can alter holder wealth.
Price chart alone incomplete.
Сценарий 37. Stablecoin ranges 0.995–1.005
This is normal peg noise, not ordinary speculative consolidation.
Interpret relative to design target.
Сценарий 38. Stablecoin range widens 0.95–1.02
Depeg risk, not generic breakout setup.
Reserve/redemption analysis dominates.
Сценарий 39. NFT floor ranges but bids decline
Visible ask stable, executable demand weaker.
Range is misleading.
Сценарий 40. NFT floor ranges with rising bids
Demand base strengthens.
Still check unique buyers and wash activity.
Сценарий 41. Illiquid token prints same price for days
No trades can mimic consolidation.
Check transaction count and depth.
Сценарий 42. Large market maker supports both sides
Stable range may depend on one provider.
Withdrawal of liquidity can change regime instantly.
Сценарий 43. Treasury selling caps upper range
Operational supply meets demand.
Track disclosed/on-chain treasury flows.
Сценарий 44. Whale accumulating near lower range
Could strengthen support if entity classification reliable.
One whale is not entire market.
Сценарий 45. Whale distributing near upper range
Supply pressure evident if actual swaps confirmed.
Strong demand can still absorb.
Сценарий 46. Range persists far longer than expected
Opportunity cost grows and strategy assumptions may expire.
Use time review.
Сценарий 47. Range narrows to tiny width
Volatility compression extreme.
Do not infer direction; prepare wider post-break volatility.
Сценарий 48. Range suddenly expands but no break
Volatility regime changes inside same broad boundaries.
Old stop distances may be too tight.
Сценарий 49. Correlated assets all break together
Systemic catalyst/liquidity shift likely.
Portfolio exposure larger than individual charts imply.
Сценарий 50. One asset fails breakout while peers hold
Idiosyncratic weakness or local liquidity issue.
Compare relative strength and fundamentals.
Сценарий 51. Breakout target reached instantly
Fast gap may have poor depth; profit taking can be violent.
Execution plan matters more than perfect target.
Сценарий 52. Breakout moves slowly with steady volume
Acceptance grows progressively.
Still watch catalyst decay and new supply.
Сценарий 53. Price returns into range after days above
Failed acceptance rather than simple wick.
Previous breakout thesis needs re-evaluation.
Сценарий 54. Price returns then breaks same direction again
First move may have cleared liquidity/positioning.
Second attempt is new event, not proof first thesis was right.
Сценарий 55. Range trader has ten wins then one huge loss
Classic regime-change risk.
Review stop and sizing, not win rate alone.
Сценарий 56. Breakout trader has several false starts
Low win rate can still work if true break gains larger.
Expectancy depends on average win/loss and costs.
Сценарий 57. Fees consume small range edge
Mean-reversion gross profit too small.
All-in break-even can make strategy negative.
Сценарий 58. Slippage increases near boundary
Many orders and volatility reduce execution quality.
Use actual fills in journal.
Сценарий 59. Range strategy works only in one market regime
Performance decays once volatility/trend changes.
Tag trades by regime.
Сценарий 60. No clean range exists
Trying to force boundaries creates hindsight rectangles.
No-trade is valid conclusion.
Чек-лист консолидации: как построить сценарий без предсказания направления
- Выбрать timeframe и не менять его после сигнала.
- Определить upper/lower boundary как зоны.
- Посчитать ширину range в процентах.
- Оценить длительность и число meaningful tests.
- Сравнить realised volatility с предыдущим периодом.
- Проверить volume, но не путать его с liquidity.
- Проверить spread, depth и price impact своего размера.
- Оценить holder/unlock/treasury flows, если они релевантны.
- Сформулировать evidence for accumulation и distribution отдельно.
- Определить критерий true breakout: close, acceptance, retest или иной.
- Определить false-break/invalidation condition.
- Stress-test выход вверх и вниз.
- Проверить корреляцию с остальным портфелем.
- Записать position size, stop, time review and maximum loss.
- Не использовать слово «накопление» как факт без подтверждений.
Практикум: измеряйте range одинаковой формулой
Если сегодня width считается между wick extremes, а завтра между closing prices, временной ряд становится несопоставимым. Выберите метод заранее: например, operational boundaries по зонам repeated closes плюс отдельные extreme wicks как stress reference.
Стабильная методика важнее идеальной линии. Её задача — позволить сравнивать ширину, длительность и качество нескольких консолидаций без hindsight.
Практикум: храните upper и lower boundary как диапазоны
Реальный рынок редко разворачивается по одному точному числу. Orders распределены вокруг области, поэтому несколько реакций на 99.8–100.4 разумнее описывать зоной, чем линией 100.00.
Zone-based approach также уменьшает ложное ощущение, что каждый прокол на один tick является breakout.
Практикум: фиксируйте midpoint
Midpoint range — простая reference value между upper and lower boundaries. Price, регулярно возвращающаяся к midpoint, показывает mean-reverting behaviour.
Если после серии тестов рынок всё чаще держится выше midpoint, internal structure becomes stronger, но direction resolution всё равно не гарантирован.
Практикум: считайте time-in-range
Запишите долю candles или времени, проведённого внутри operational boundaries после их формирования. Чем выше time-in-range, тем больше оснований говорить о настоящем regime, а не краткой паузе.
При этом слишком длинный range может означать потерю внимания и liquidity, поэтому длительность нужно читать вместе с depth and turnover.
Практикум: измеряйте excursion beyond boundary
Для каждого false break сохраните, на сколько процентов price вышла за edge before returning. Это помогает понять обычный шум конкретного range.
Stop placed inside typical false-break excursion будет регулярно выбиваться even when mean-reversion thesis remains intact.
Практикум: measuring return speed
Запишите, сколько времени требуется price, чтобы после boundary test вернуться к midpoint. Быстрые rebounds означают сильную opposite-side response; медленные — weaker reaction.
Trend in return speed can reveal changing internal pressure before boundary finally gives way.
Практикум: compare bounce magnitude
After lower-bound tests calculate how far rebound reaches: midpoint, upper third or full opposite edge. Если каждый subsequent bounce smaller, buyers may be losing initiative.
Это не deterministic breakdown signal, but quantitative description better than phrase ‘support weakens’.
Практикум: compare rejection magnitude
After upper-bound tests measure downside reaction. Shrinking rejections can indicate offers absorbed or increasing demand.
Again, use as evidence weight, not prediction.
Практикум: separate touch count from traded volume
Ten tiny touches with negligible activity are not equivalent to two tests involving large turnover.
Boundary significance should combine interaction count, volume, duration and price response.
Практикум: track depth asymmetry
Compare executable depth above and below current price for equal distances and notional. If bids steadily deepen while asks thin, short-term microstructure tilts upward.
Order-book data can change rapidly and can be cancelled, so asymmetry is context, not promise.
Практикум: track cancellation rate conceptually
Displayed large orders may disappear before execution. If your data source supports it, distinguish persistent resting liquidity from fleeting quotes.
High cancellation weakens confidence that apparent support/resistance has real executable backing.
Практикум: volume per unit range
Divide turnover by range width or realised volatility to estimate how much trading occurred without large price displacement. High turnover with narrow range can indicate strong two-sided absorption.
However, wash-like activity or repeated arbitrage can inflate turnover, so entity/venue quality matters.
Практикум: liquidity-adjusted breakout threshold
Instead of requiring a fixed 1% move outside range, consider how much order flow is needed to clear nearby depth. Thin markets can move 3% on small trade; deep markets may need substantial capital for 1%.
Breakout significance should be scaled to market quality, not one universal percentage.
Практикум: distinguish close from acceptance
A candle can close outside range seconds before interval end and immediately reverse next period. Acceptance requires more persistent trading beyond boundary.
Define acceptance operationally: time, volume, number of closes or successful retest.
Практикум: define failed acceptance
Price spends some time outside range, then loses boundary and trades deeply back toward midpoint. This is stronger failure than a tiny wick.
Journal such cases separately because their subsequent behaviour may differ.
Практикум: map liquidation sensitivity
If derivatives data available, note whether estimated liquidation clusters sit just outside range. Breakout may trigger forced flow and extend faster than spot-only model suggests.
Do not treat liquidation maps as exact; use them as stress context.
Практикум: mark scheduled events
Add calendar for unlock, governance vote, protocol upgrade, macro release or court/regulatory event relevant to asset.
Range that persists into event often has different risk than quiet range with no known catalyst.
Практикум: mark unscheduled risk
Exploits, stablecoin depegs, bridge failures and whale events cannot be scheduled. Position sizing should survive unexpected break rather than assume all catalysts known.
This is why low-volatility history never justifies unlimited leverage.
Практикум: compare consolidation with benchmark
An altcoin can look range-bound in USD while trending down against BTC or sector index. Relative chart shows whether capital is actually rotating away.
Absolute and relative consolidation answer different questions.
Практикум: compare sector breadth
If one asset consolidates while peers break upward, lagging relative strength may be meaningful. If entire sector ranges together, macro or sector-level uncertainty likely dominates.
Use peer comparison to separate idiosyncratic and systemic regimes.
Практикум: use volatility percentile
Compare current realised volatility with its own historical distribution, not another asset. A 4% weekly range can be extremely quiet for one token and normal for another.
Percentile framing makes compression more interpretable.
Практикум: do not annualize calm blindly
One quiet week annualized into volatility estimate can understate tail risk dramatically.
Use longer baseline and stress periods when sizing.
Практикум: separate low volatility from low risk
Risk includes liquidity, smart-contract, governance and event uncertainty. Price can remain flat while protocol risk rises.
A narrow range is only one observable dimension.
Практикум: inspect failed transaction rate
For on-chain markets, congestion or contract issues can worsen execution even while price range narrow.
Operational friction may become critical during breakout.
Практикум: watch gas/priority fee changes
Rising transaction cost can indicate network congestion or competitive activity. A range trader may discover exit costs suddenly higher during break.
Include dynamic network cost in stress test.
Практикум: stablecoin quote risk
If asset is quoted in stablecoin, temporary depeg can distort range boundaries in USD-equivalent terms.
Cross-check with independent benchmark when movement seems isolated.
Практикум: supply changes inside range
Mint, burn, rebase, vesting and unlock can change economics while unit price remains flat.
Track market cap and free float alongside price.
Практикум: treasury behaviour inside range
Consistent treasury distributions can cap upside without dramatic chart event. Conversely buybacks can support demand.
Use confirmed flows and avoid assigning hidden motive.
Практикум: holder concentration trend
If top independent entities steadily gain share while retail count falls, ownership concentration rises despite flat price.
This can alter future liquidity and governance risk.
Практикум: age of coins/tokens moved
Where reliable on-chain data exists, older holdings becoming active can signal changing supply availability.
Movement is not sale automatically; destination and economic action matter.
Практикум: range and realised profit
Stable price with high realised profit-taking suggests incoming demand absorbs sellers. Stable price with low activity is a different structure.
Ownership transfer matters more than visual rectangle.
Практикум: range and unrealised loss
Many holders above current price may use rallies to exit near break-even, creating recurring supply at upper range.
Cost-basis distribution can explain repeated resistance but is model-dependent.
Практикум: inventory overhang
Project, treasury, miner or validator operating expenses can create recurring sells independent of market sentiment.
Range may persist until demand absorbs this structural supply.
Практикум: market-maker dependency
If one liquidity provider supplies most depth, apparent stable range can depend on its risk limits.
Monitor whether depth remains diversified across sources.
Практикум: cross-chain fragmentation
Same token can have different liquidity on several networks. One venue may break range while canonical/global price stays inside.
Aggregate carefully and understand bridge basis.
Практикум: oracle-linked protocols
Consolidating collateral price may lead users to increase leverage. Later breakout creates outsized liquidations.
Protocol health factors belong in systemic stress analysis.
Практикум: funding neutrality can hide gross leverage
Funding near zero does not mean no leverage; long and short demand can be balanced at high open interest.
Gross crowded positioning can make both breakout directions violent.
Практикум: open-interest growth relative to spot volume
Rapid derivatives growth while spot volume flat suggests leverage becoming larger part of price discovery.
Use as risk context, especially near narrow boundaries.
Практикум: open-interest decline with stable spot
Closing leveraged positions without price displacement can reduce future cascade risk.
Deleveraging is not bullish or bearish itself.
Практикум: false-break frequency
Count false breaks per week/month. If frequent, breakout strategy requiring first close may have poor win rate.
Adapt confirmation rule from actual asset behaviour rather than generic textbook.
Практикум: breakout follow-through distance
Measure maximum favorable excursion after confirmed break. This shows whether range-width targets historically realistic for this asset/regime.
Do not optimize target from one best example.
Практикум: return-to-range rate
How often price returns inside within one, three or ten candles after crossing boundary? This is directly relevant to confirmation delay.
Historical statistics cannot guarantee future but improve realism.
Практикум: transaction costs by regime
Spread/slippage often widen during breakout. Backtest using calm-range costs will overstate strategy returns.
Use stressed execution assumptions.
Практикум: stop slippage distribution
Record actual fill versus trigger across prior breaks. Tail slippage matters for position sizing.
Average slippage alone can hide rare large gaps.
Практикум: range-trade expectancy
Calculate win rate, average win, average loss and all costs for mean-reversion entries. A high win rate can still be negative if breakout losses large.
Focus on expectancy and max drawdown.
Практикум: breakout-trade expectancy
Many small false-break losses may be acceptable if true trends produce large gains.
Again, full distribution matters more than percent winners.
Практикум: compare both strategies
Same range may support mean reversion before break and trend following after break, but combining without regime rules creates conflicting decisions.
Define when one playbook stops and the other begins.
Практикум: no-trade zone
Mid-range or unclear boundaries can be explicitly marked as no-action area.
Removing low-quality decisions often improves process more than adding indicators.
Практикум: alert design
Set alerts near boundary, volume expansion or volatility change so research begins before emotional breakout candle.
Alerts are prompts to inspect, not automated buy/sell commands.
Практикум: screenshot discipline
Save chart and metrics before breakout. After outcome, compare without redrawing boundaries.
This prevents hindsight bias.
Практикум: write bullish and bearish scenario simultaneously
Bull case: acceptance above upper range with adequate liquidity. Bear case: failure/acceptance below lower range. Add neutral case: continued rotation.
Three-scenario framing reduces compulsion to predict one direction.
Практикум: assign probabilities cautiously
Probabilities can be subjective but force explicit uncertainty. Do not use fake precision like 73.4% without data.
Ranges or qualitative confidence often more honest.
Практикум: predefine evidence that changes probability
For example, strong spot volume above range increases bullish weight; treasury distribution and weaker depth increase bearish weight.
Updating evidence is better than defending initial narrative.
Практикум: post-mortem without outcome bias
A losing breakout with correct risk may be good process; a winning random entry can be bad process.
Score research, execution and risk separately from PnL.
Практикум: classify error type
Boundary error, liquidity error, news surprise, size error, leverage error, delayed exit, thesis drift. Repeated categories show where process fails.
Generic ‘market manipulated’ explanation teaches little.
Практикум: range inventory age
If planned short-term position sits inside consolidation much longer than intended, capital purpose changed.
Use time review to decide whether thesis remains valid.
Практикум: opportunity cost
Flat asset can be riskier economically than chart suggests because capital misses alternatives.
Opportunity cost doesn’t force trade, but should be visible.
Практикум: cash is a position
Choosing not to trade ambiguous range preserves optionality for clearer setup.
No-trade is valid analytical conclusion.
Практикум: portfolio heat
Sum maximum losses of all range trades under simultaneous breakout. If result exceeds risk budget, nominal position sizes too large collectively.
Correlation stress matters more than individual stops.
Практикум: avoid averaging losers automatically
Buying lower repeatedly inside range works until range breaks. Averaging increases exposure precisely near invalidation.
Any scale-in must have maximum total size and breakdown plan.
Практикум: avoid pyramiding winners without structure
Adding on each small move near upper boundary can create oversized position before false break.
Scale only according to predefined confirmation.
Практикум: range and leverage reset
If volatility compression tempted leverage increase, explicitly recalculate loss under 2x or 3x normal recent move.
Use stress volatility, not last week’s calm.
Практикум: range and news source quality
Rumours can create temporary boundary probes. Verify primary source before interpreting as fundamental breakout.
Price can move on false information and reverse after correction.
Практикум: distinguish narrative breakout from liquidity breakout
Social attention may spike while depth unchanged. Price jumps because few offers, not because broad capital repriced asset.
Measure new independent demand.
Практикум: distinguish genuine demand from short covering
Up move with falling open interest can partly reflect short exits. Up move with growing spot volume may have different structure.
Neither is automatically better; follow-through decides.
Практикум: distinguish genuine supply from long liquidation
Down move with forced liquidations can overshoot fundamental repricing.
After cascade, range may reform at new level.
Практикум: range migration after breakout
Price may leave 100–110 and consolidate 115–125 rather than trend continuously.
This is new equilibrium; do not keep trading old range.
Практикум: invalid old boundaries
Once market accepts far outside previous range, old midpoint and edges lose operational priority.
Historical levels remain context, not active system forever.
Практикум: keep methodology simple
Range analysis can become overloaded with dozens indicators. Core variables remain price structure, time, volume, liquidity and risk.
Add indicators only if they change a decision and can be tested.
Практикум: one-page range card
For each asset save timeframe, boundaries, width, duration, volatility percentile, volume trend, depth, spread, catalyst calendar, supply events, breakout rule and risk limit.
This compact card is more useful than unstructured chart commentary.
Контроль: боковик после нового ATH
Когда asset устанавливает исторический максимум и затем несколько недель торгуется чуть ниже него, range может быть зоной price discovery, где ранние holders фиксируют прибыль, а новые buyers оценивают более высокую valuation. Нельзя автоматически назвать такую структуру bullish continuation.
Сравните current supply, funding, spot demand, depth and holder flows. Если цена держится near record despite large realised supply, absorption is meaningful evidence; если depth deteriorates and rallies fail, risk profile different.
Контроль: боковик глубоко ниже ATH
Range на −70% или −90% от historical maximum психологически воспринимается как «дешёвое накопление». Но old ATH может быть irrelevant after dilution, competition or failed product thesis.
Перед accumulation label пересчитайте implied market cap at old ATH and ask whether current network economics justify recovery. Distance from peak only defines historical drawdown.
Контроль: range при растущем circulating supply
Unit price stable while more tokens enter circulation means aggregate market capitalization rises. Demand is absorbing new supply even without price appreciation.
Это может быть constructive evidence, but future dilution remains. Model next unlock instead of extrapolating current stability indefinitely.
Контроль: range при shrinking supply
Burn or redemption reduces units while price remains flat. Aggregate value may decline or remain similar depending scale.
If strong scarcity story fails to lift price, demand conditions deserve review. Supply reduction alone is not guaranteed breakout engine.
Контроль: range around treasury buyback
Project buys tokens periodically, supporting demand inside lower range. Once program ends, one structural buyer disappears.
Estimate buyback share of total demand. A range sustained mainly by treasury can behave differently after budget exhaustion.
Контроль: range around emission rewards
Liquidity mining or staking incentives continuously distribute new units while users buy or hold them. Price stability hides transfer from protocol issuance to market participants.
Measure net issuance and retention after rewards decline. Artificially subsidized equilibrium may not persist.
Контроль: range with declining active users
Price can remain stable while product activity deteriorates because speculative holders are slow to reprice. This divergence can last surprisingly long.
Fundamental weakness is not a timing signal, but it changes downside scenario if liquidity eventually breaks.
Контроль: range with rising fees/revenue
Protocol economics can improve while token price stays sideways. Market may be waiting for proof of persistence, or token may lack direct value capture.
Trace exact mechanism from user activity to token demand before treating range as undervaluation.
Контроль: range and governance proposal
Proposal to change emissions, fees or treasury can keep price compressed while participants wait for vote and implementation.
Read proposal text, quorum, timelock and code execution. Social headlines often compress several uncertain stages into one catalyst.
Контроль: range and legal/regulatory uncertainty
Market can remain balanced while participants wait for legal clarification. When decision arrives, both price and liquidity may gap because resting orders withdraw.
Position sizing should anticipate discontinuous move rather than assume orderly breakout.
Контроль: range after chain outage
Network recovers technically, but holders reassess reliability. Price can stabilize before trust fully returns.
Track validators, transaction success, users and incident remediation. Sideways price alone doesn’t mean incident risk resolved.
Контроль: range after bridge exploit
Base asset may trade sideways while wrapped liquidity or ecosystem capital exits. The chart hides structural damage in connected markets.
Separate native network health from bridge-dependent liquidity.
Контроль: range with exchange-like volume but weak on-chain activity
Turnover can remain high because traders speculate even while product usage falls. Trading interest and utility demand are different flows.
Do not use volume alone as proof of adoption.
Контроль: range with strong on-chain activity but low turnover
Users may use network without frequently trading native token. This can be healthy product usage but weak direct token demand depending fee/value-capture design.
Again, map economic link rather than assume every activity metric predicts breakout.
Контроль: range after token redesign
Migration, rebase or tokenomics change can create a new equilibrium where old chart boundaries have little meaning.
Use adjusted series and new supply rules. Historical support/resistance becomes secondary when unit economics changed.
Контроль: range with very concentrated holders
A few entities may control much of free float. Stable price can depend on their inactivity.
Stress scenario should ask what happens if one entity sells fraction of position relative to current depth.
Контроль: range with improving holder distribution
Ownership spreads across more independent entities while price stable. This may reduce concentration risk and improve resilience.
Wallet count alone is insufficient; exclude contracts, bridges, custodians and sybil-like addresses.
Контроль: range and stablecoin liquidity
If stablecoin balances/liquidity around ecosystem shrink, future buying capacity may weaken even while current price stays flat.
Stablecoin metrics are contextual and should not be treated as deterministic dry-powder indicator.
Контроль: range and broad risk-off environment
Individual token may consolidate because project-specific buyers offset macro sellers. If broad market stress intensifies, local support can fail despite unchanged project fundamentals.
Always include systemic scenario.
Контроль: range and broad risk-on environment
Asset staying flat while peers rally shows relative weakness. This may indicate supply overhang or low interest.
Relative underperformance does not guarantee breakdown, but it belongs in opportunity-cost analysis.
Контроль: journal review after 20 ranges
After enough examples, compare which variables actually preceded successful breakouts in your sample: acceptance, spot volume, depth, holder flow, event resolution or none consistently.
This prevents importing textbook patterns that do not match your market universe. Research process should become more empirical over time.
Контроль: retire a rule that stopped working
Market microstructure changes. A confirmation method that worked last year can degrade when participant mix, leverage or liquidity changes.
Keep versioned strategy notes and require fresh evidence before relying on old statistics.
Финальная проверка: можно ли описать range без прогнозных слов
Попробуйте сформулировать состояние рынка без слов «накопление», «раздача», «готовится рост» и «готовится падение». Например: цена 18 дней торгуется между 92 и 100, realised volatility снизилась, volume стабилен, depth у нижней границы вырос, ближайший unlock через 12 дней.
Такое описание отделяет наблюдаемое от интерпретации и резко снижает риск narrative bias.
Финальная проверка: что действительно изменилось внутри диапазона
Сравните начало и конец consolidation по одинаковым полям: supply, holders, liquidity, spread, volume, open interest, funding, users and catalyst status. Если ничего существенного не изменилось, уверенность в directional thesis не должна расти только потому, что прошло больше времени.
Duration itself is information, but not proof of hidden buying or selling.
Финальная проверка: кто должен стать marginal buyer после breakout
Для upside scenario назовите источник нового спроса: product users, new capital, short covering, institutional flow, reduced supply or specific catalyst. Для downside — источник нового предложения: unlock, treasury, liquidations, risk-off flows.
Если сценарий не объясняет marginal flow, он слишком абстрактен.
Финальная проверка: выдержит ли позиция возврат в midpoint
После breakout price часто retests old range. Если обычный return to midpoint already exceeds risk budget, position too large or leverage too high.
Stress-test should include not only ideal continuation, but failed acceptance and full re-entry into range.
Финальная проверка: что вы будете делать при продолжении боковика
Не каждый range обязан завершиться в нужный срок. Если price остаётся внутри ещё месяц, заранее решите: hold, reduce, exit by time stop or reassess catalyst.
Без neutral scenario trader becomes emotionally dependent on breakout.
Финальная проверка: не создана ли видимость точности
Boundary 97.342 выглядит научно, но market interactions rarely justify three decimals. Excess precision can hide subjective line drawing.
Use ranges and confidence levels consistent with data quality.
Финальная проверка: все ли источники синхронизированы по времени
Volume, price, on-chain holders and derivatives metrics могут обновляться с разной задержкой. Сравнение snapshots from different moments creates false relationships.
For post-mortem save timestamps and source methodology.
Финальная проверка: не подменяет ли индикатор сам рынок
Indicator can summarize price/volume, but cannot create information not present in source data. Multiple correlated indicators may all repeat same fact.
Prefer a few independent dimensions: price structure, liquidity, supply/holder flows, fundamentals and positioning.
Финальная проверка: есть ли право отказаться от вывода
Sometimes data genuinely ambiguous: boundaries unstable, sources conflict, liquidity fragmented. Correct answer can be «консолидация не подтверждена» or «direction unclear».
Uncertainty is not analytical failure; fake certainty is.
Финальная проверка: survive first, predict second
No range thesis is valuable if one false break creates irreversible loss. Maximum loss, portfolio heat and liquidity-adjusted execution belong before directional conviction.
Robust process remains usable even when market chooses the scenario you considered less likely.
Последний тест: сравните range с простым benchmark
Если актив месяц стоит в боковике, а широкий рынок за это время вырос на 25%, относительный результат слабее, чем кажется по горизонтальному графику. Если рынок падает, а актив удерживает диапазон, относительная устойчивость выше. Такой benchmark не предсказывает breakout, но помогает понять, является ли консолидация локальной особенностью или частью общего режима.
Используйте одинаковый период и одну базовую валюту, иначе relative-strength comparison будет искажён.
Последний тест: не путайте стабильность цены со стабильностью риска
Внутри диапазона могут одновременно ухудшаться treasury runway, validator economics, smart-contract control, legal environment или bridge security. Цена способна реагировать с задержкой, особенно когда ликвидность тонкая и активность невысока. Поэтому финальный range report должен содержать не только chart metrics, но и список non-price risks, которые изменились за период.
Если фундаментальный риск вырос, прежняя техническая граница не становится сильнее только потому, что цена ещё её не пробила.
Последний тест: диапазон должен быть полезен для решения
Если после построения десяти линий, индикаторов и профилей вы всё равно не можете сформулировать конкретный risk scenario, analysis перегружен. Хороший range model отвечает на практические вопросы: где thesis теряет силу, какой размер можно безопасно исполнить, какие события способны изменить режим и что делать при продолжении боковика.
Количество инструментов не равно качеству. Простая измеримая модель обычно лучше сложной схемы, которую невозможно повторить через месяц.
Последний тест: сохраните исходную карту до движения
До breakout сохраните boundaries, metrics, screenshots и сценарии. После движения не передвигайте старые границы, чтобы они идеально объясняли результат. Такой архив показывает, насколько модель действительно работала в реальном времени, и помогает отличить полезный анализ от hindsight.
Именно повторяемость делает консолидацию аналитическим объектом, а не рисунком, который становится очевидным только после того, как рынок уже ушёл.
Итог
Консолидация в крипте — это период относительного баланса, когда цена проводит время внутри диапазона и не продолжает устойчиво предыдущий тренд. Это описание рыночной структуры, а не готовый прогноз. Один и тот же боковик может быть continuation, accumulation, distribution, deleveraging или просто периодом ожидания.
Качественный анализ range начинается с измерений: timeframe, boundaries, width, duration, realised volatility, volume, spread, depth and price impact. Если этих полей нет, слова «сильное накопление» и «готовится выход» чаще отражают narrative, чем данные.
Особенно важно различать volume и liquidity. Высокий turnover внутри консолидации не гарантирует, что ваша позиция может быть закрыта по близкой цене. Для практического риска важны реальные bids/reserves and size-aware execution.
Breakout тоже не является бинарным событием. Первый wick outside range может стать ложным выходом. Close, acceptance, retest, liquidity and participation помогают оценить качество перехода, но ни один фильтр не даёт гарантии. Чем больше подтверждений вы требуете, тем позже получаете цену — это неизбежный trade-off.
Для пользователя полезнее всего строить два сценария до движения: что изменится при принятии цены выше range и что произойдёт при breakdown ниже. Когда обе стороны заранее имеют invalidation, position size and risk budget, консолидация перестаёт быть загадкой, которую нужно угадывать.
Для продолжения используйте OneMagic на новом домене: технический анализ, ликвидность, price impact, капитализацию и размер позиции. Эти материалы позволяют оценивать range как систему risk, а не как красивый прямоугольник на графике.